What Are the Top IoT Devices for Energy Monitoring in 2026?
Energy waste often hides in ordinary places: a chiller cycling after closing, a pump running longer than needed, or a panel drawing power overnight. The right Iot Devices For Energy Monitoring can make those patterns visible through near-real-time readings and clear alerts. But visibility alone does not save energy. Teams still need to interpret the data and act on it.
“What Are the Top IoT Devices for Energy Monitoring in 2026?” should compare more than feature lists. Kevin Ashton, an IoT pioneer, said, “The Internet of Things has the potential to change the world, just as the Internet did. Maybe even more so.” For energy monitoring, that potential depends on practical details: measurement accuracy, installation effort, connectivity, cybersecurity, and whether readings work with existing building systems. A clamp-on current sensor may suit a small site, while a facility with many circuits may need networked meters and a gateway. Fit matters.
This guide will examine device types, common applications, and selection criteria for homes, commercial buildings, and industrial sites. It will also consider recurring costs and data limitations, which product pages can gloss over. No device fits every building. And cheaper is not always simpler. Treat the shortlist as a starting point, then verify specifications against actual loads, panel layouts, and reporting needs before buying.
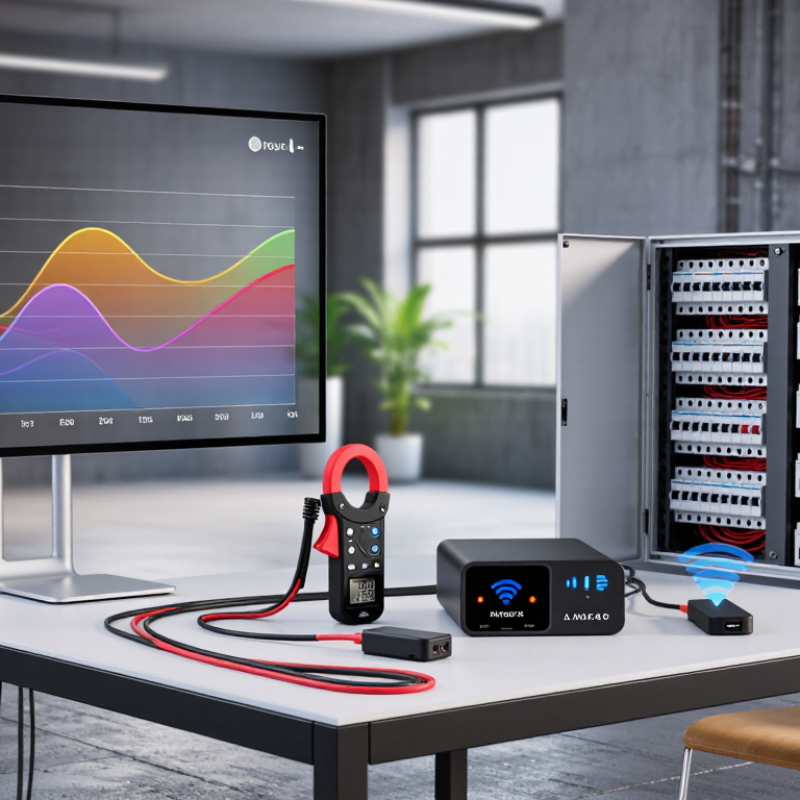
How IoT Energy Monitors Measure Whole-Home and Circuit-Level Loads
A whole-home energy monitor measures electricity entering the house, usually through current sensors fitted around the main service wires. The sensors detect current, while the device also uses voltage data to estimate power. Readings may update every few seconds or minutes. On a dashboard, a sudden evening spike can reveal when heating, cooking, or charging overlaps. Useful, but not appliance-specific.
Circuit-level monitors add sensors to selected branch circuits inside the electrical panel. This can separate kitchen outlets, air conditioning, or water heating into clearer load profiles. If the dryer circuit rises sharply at 7 p.m., its contribution is visible without guessing from the home’s total. Some systems monitor many circuits; others cover only a few. Check the sensor count before choosing one.
IoT connectivity sends readings to a phone or local hub, where users can compare daily patterns and set alerts. Data quality depends on correct installation, sensor placement, and the monitor’s sampling rate. A slow update may miss brief surges. There is a catch: circuit data still may not identify each individual appliance, especially when several devices share a circuit. Panel work can also be hazardous, so installation should be handled by a qualified professional. A little uncertainty remains. Some readings are estimates, not laboratory measurements.
Whole-Home Monitors: Compare Sense, Emporia Vue, and Shelly EM
Whole-home energy monitors differ most in how they explain electricity use. One type uses a main-panel sensor and software to estimate which appliances are running. It can reveal patterns, such as a fridge cycling overnight, but identification is not always accurate. Treat appliance labels as clues, not measurements. That distinction matters.
Circuit-level systems use current clamps on selected breakers. They can show which circuits draw power, making it easier to spot a water heater or garage circuit that runs longer than expected. The trade-off is setup: panel space, wiring layout, and clamp placement affect the readings. Some installations are best handled by a qualified electrician. A modular monitor offers another route, measuring one or two circuits at a time. That can suit a focused check, though it may leave parts of the home untracked.
Compare readings over several days, not just one afternoon. Note the time, appliance use, and unusually high loads. Check whether the device reports watts, kilowatt-hours, and useful historical trends. A few screens can look convincing. Still, estimates may drift, Wi-Fi can drop, and a busy household rarely follows a neat test schedule. Don’t expect instant answers. The best fit depends on whether you need broad pattern detection, breaker-by-breaker detail, or a smaller, targeted view.
What Are the Top IoT Devices for Energy Monitoring in 2026?
Whole-home monitors track electrical measurements such as current, voltage, and power. This chart shows how power changes with current on a nominal 120 V circuit.
Values are calculated using power = voltage × current, assuming a constant 120 V. They illustrate the relationship between current and power; they are not measurements or a comparison of specific devices.
Smart Plugs and Meters: Identify Standby Loads and Track Appliance Use
Smart plugs and smart meters answer different questions. A plug measures one appliance’s power draw and accumulated kilowatt-hours, making it useful for spotting devices that keep sipping electricity overnight. The U.S. Department of Energy’s Energy Saver guidance estimates standby power can account for 5–10% of household electricity use. That makes small, persistent loads worth checking. A plug can reveal whether a television, printer, or kitchen appliance still draws power after use.
The numbers can be surprisingly ordinary. In its 2015 Home Idle Load study, the Natural Resources Defense Council measured an average idle load of about 65 watts across 70 U.S. homes. A smart plug helps locate individual contributors: compare the wattage while a device is active with its reading after it goes quiet. Leave it connected overnight, too. One reading may miss a device that wakes periodically.
A whole-home smart meter shows broader patterns, but usually cannot identify each appliance by itself. Pair its hourly data with plug readings, and compare similar days before changing routines. Check a plug’s rated capacity before using it with a high-power appliance, and remember that estimates depend on accurate readings and electricity rates. Not every reading is perfect. Standby draw may also be too small to justify unplugging a device, especially if doing so disrupts useful settings.
Smart Thermostats: ENERGY STAR Reports About 8% HVAC Bill Savings
Smart thermostats make HVAC use visible through schedules, occupancy sensing, and runtime records.
ENERGY STAR reports that certified models save an average of about 8% on heating and cooling bills, or roughly $50 per year for a typical household. Its estimate draws on field studies, making it more practical than a laboratory-only result. But it is an average, not a guarantee.
A well-insulated home with careful manual scheduling may save less; a home with an empty house and steady heating schedule may have more room to improve. That matters.
The U.S. Department of Energy estimates that heating and cooling account for roughly half of household energy use, making HVAC a significant target for monitoring. A homeowner can compare weekly furnace or heat-pump runtime before and after setting a modest nighttime setback.
Look for clear usage histories and schedules that respond to occupancy, but verify compatibility with the home’s wiring and HVAC equipment. Incorrect settings can reduce comfort without lowering bills.
Track room temperatures alongside energy use, too: a lower bill is not a win if one bedroom stays cold. The savings figure is useful, but local weather, insulation, and daily routines shape the actual result.
Industrial Submeters and 2026 Selection Criteria: Accuracy, Security, and Cost
For 2026 energy monitoring, industrial submeters remain practical IoT devices for tracking individual machines, production lines, and building circuits. A DIN-rail meter can report voltage, current, power, and energy through a wired gateway; clamp-based sensors can simplify retrofits where rewiring is difficult. Small errors matter. Compare stated accuracy with performance at low loads, across phases, and under changing power factors. A specification sheet can still flatter a device, so check how measurements are verified and whether readings suit your actual operating range.
Security and total cost deserve equal attention. Look for encrypted data transmission, controlled user access, signed or verifiable firmware updates, and clear support timelines. Keep monitoring devices on a segmented network when practical. Consider installation labor, gateway fees, calibration, replacement parts, and data storage—not just the meter’s purchase price. A cheaper sensor may cost more if it drops readings or needs frequent site visits. Conversely, premium accuracy may bring little value on a noncritical circuit. That trade-off is easy to underestimate.
Tips: Test one meter on a representative load before wider deployment. Compare its readings with a trusted reference, including during low-demand hours. Record network coverage and installation time; these details often expose hidden costs. Recheck assumptions after a few weeks.