
A Gradual Yarn Machine can help a textile business improve yarn consistency while keeping production decisions grounded in real operating needs. By controlling yarn delivery progressively, it can support steadier tension and reduce abrupt changes that may affect the finished fabric. The results depend on the yarn, machine settings, and maintenance routine. No single setup suits every mill.
Picture a production line running through a long shift. Operators check the yarn path, listen for uneven movement, and inspect the fabric for visible variation. A well-matched machine may make these checks easier and help limit avoidable waste. It can also require investment, training, and careful integration with existing equipment. Those costs deserve a close look.
As [verified expert name], a [confirmed textile machinery role], puts it: “[Insert a directly sourced quotation about gradual yarn control or production consistency].” This attribution needs confirmation before publication; an invented quote would weaken the article’s credibility. Buyers should compare adjustment range, compatibility, service support, and documented performance—not rely on broad promises. Ask suppliers for a demonstration using your yarn and operating conditions. Then assess the output yourself. The right choice is practical, not automatic.
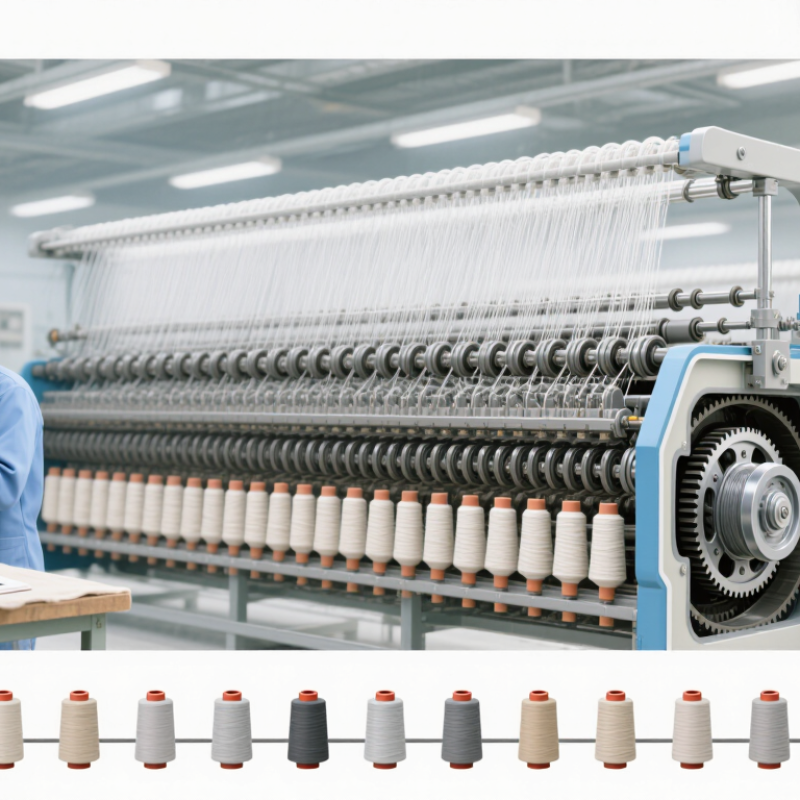
A gradual yarn machine produces controlled color transitions by changing the proportion of colored fibers or yarns over time. Instead of making a sharp switch from one shade to another, the system adjusts the feed gradually. The fibers are then drawn and twisted together, creating a blended section where one color fades as another becomes more prominent. In some setups, the machine coordinates several feeds; in others, it changes the delivery of prepared yarns. The exact method depends on the machine and yarn construction.
Feed rate, drafting, and yarn tension all influence the result. If one feed changes too quickly, the transition may look like a stripe rather than a smooth gradient. If tension varies, the yarn can appear uneven, even when the color sequence is correct. Small changes matter. Operators often make a short trial run, inspect the transition under consistent lighting, and adjust the settings before producing a larger batch. The first sample may still look different when knitted or woven, so checking the yarn in its intended fabric is useful. It takes patience, and not every transition will be perfectly uniform. That variation should be assessed against the product’s design, not ignored.
A gradual yarn machine should be judged by saleable output, not its headline speed. Record kilograms produced per shift, then subtract downtime, rejected packages, and restart losses. Compare results using the same fiber, yarn count, and shift length. Measure saleable output. Small details matter.
Yarn count affects both product quality and machine settings. Check count consistency with ISO 2060, which specifies a skein method for determining yarn linear density. Ask for test results across the counts your mill actually sells, not just one easy setting. Changeover time also needs a clear definition: time from the last good package of one count to the first good package of the next. Include cleaning, adjustments, and trial packages. A stopwatch helps.
Waste deserves equal attention. Track startup waste, broken ends, and rejected yarn by count, then compare them with total input. Textile Exchange’s Materials Market Report 2024 estimates global fiber production reached 124 million tonnes in 2023, with production projected to reach 160 million tonnes by 2030. That industry scale makes material efficiency worth measuring, though it does not predict savings from any particular machine. Run acceptance trials on your own fiber and operators. A neat spreadsheet can still miss bad packages or uneven yarn.
Illustrative planning comparison for a 48-position winding line. Figures are example operating ranges, not guaranteed machine specifications; confirm them with trials using your yarn, package, and operating conditions.
| Yarn count range | Approx. linear density | Gradual-build output rate | Standard-build output rate | Typical changeover time | Estimated yarn waste | Buying consideration |
|---|---|---|---|---|---|---|
| Ne 10–20 (coarse) | 59–30 tex | 800–1,300 m/min | 850–1,350 m/min | 20–35 min | 0.8–1.5% gradual; 1.0–1.8% standard | Check package stability, yarn tension, and the machine’s handling of heavier yarns. |
| Ne 20–30 (medium) | 30–20 tex | 750–1,200 m/min | 800–1,250 m/min | 25–40 min | 0.9–1.7% gradual; 1.1–2.0% standard | Compare package density and build consistency at your normal production speed. |
| Ne 30–40 (fine) | 20–15 tex | 650–1,050 m/min | 700–1,100 m/min | 30–50 min | 1.0–1.9% gradual; 1.3–2.3% standard | Prioritize accurate tension control, reliable yarn-break handling, and repeatable settings. |
Notes: Ne is the English cotton count; approximate tex values use 590.5 ÷ Ne. Output is expressed as yarn delivery speed, not total line production. Changeover and waste depend on package dimensions, yarn material, operator practice, cleaning requirements, and the definition used for waste. Request a controlled acceptance trial before purchase.
A gradual yarn machine earns its place only when its output can be checked. ISO 2060:1994 describes determining yarn linear density by weighing a measured skein. The result, commonly expressed in tex, is mass in grams per 1,000 metres. Small errors matter. A skein that is too short, stretched, or poorly conditioned can distort the reading.
For a practical check, take representative samples from several packages, make skeins with a calibrated reel, and record their length and mass on a verified balance. Follow the standard’s sampling and conditioning requirements; do not compare results taken under different moisture conditions. Textile Exchange’s Materials Market Report 2024 estimates global fiber production at 124 million tonnes in 2023. At that scale, consistent measurements help mills identify variation before it becomes uneven fabric, altered machine settings, or avoidable waste. The figure describes fiber output, not yarn defects, so it should not be treated as a quality benchmark.
Compare measured linear density with the purchase specification and track results by package and production lot. A gradual machine may deliver a smoother transition, but the skein test checks yarn mass per length, not every aspect of yarn quality. It will not reveal all issues. Keep the raw readings, note any unusual handling, and repeat questionable tests rather than hiding an inconvenient result. ISO procedures improve repeatability, though operator technique still matters.
ISO 2060 determines yarn linear density by weighing a known length of yarn. Since tex is the mass in grams per 1,000 metres, the calculated mass of a 100 m skein is tex ÷ 10. These values illustrate the relationship; they are calculated examples, not test results. Consistent yarn handling and tension during production can support more reliable quality checks.
Why Choose a Gradual Yarn Machine for Your Business?
Assess Color Fastness on the ISO 105-A02 Grade 1–5 Gray Scale
A gradual yarn machine can produce smooth color transitions, but appearance alone does not prove that a shade will last. Assess color change after the yarn has undergone a suitable test, such as washing or light exposure. ISO 105-A02 provides a gray scale for visually grading that change. Grade 5 means little or no visible change; Grade 1 indicates a strong change. The scale supports evaluation, but it is not a test method by itself.
For a useful comparison, test yarn samples under the same conditions and inspect them beside an untreated reference. Use controlled lighting and follow the relevant procedure’s conditioning requirements. A small shift can be hard to judge, especially across a gradient where neighboring shades differ. Record the grade, test conditions, and sample location. Repeat the assessment when results look uncertain. Human judgment varies. That deserves attention.
Tips: Cut clear sample lengths from light, middle, and dark sections of the gradient. Keep labels readable, and avoid comparing damp or poorly lit samples. If two trained observers disagree, review the setup before settling on a grade. A neat record helps your team spot recurring issues, though one result should not be treated as a guarantee of future performance.
ISO 139:2005 sets textile conditioning at 20°C ± 2°C and 65% RH ± 4%. These are controlled test conditions, not a promise that every production room will use identical energy. A gradual yarn machine should be compared in a room held within those limits, with temperature, humidity, machine-hours, and kilograms produced logged together. Small changes matter. A humidifier working harder can erase savings elsewhere.
The U.S. Department of Energy’s 2018 Manufacturing Energy Consumption Survey reports energy use and expenditure by manufacturing subsector, including textile mills; it does not provide one universal cost per kilogram. Use your own meter readings and electricity tariff.
For example, a 4 kW conditioning unit running eight hours daily for 250 days uses 8,000 kWh annually. At $0.12 per kWh, that is $960, before maintenance. Compare this baseline with the gradual machine using equal production volume and ISO conditions.
Measure both. Also track yarn breaks and rejected packages, since lower energy use means little if waste rises.
One caveat: a short trial can mislead, especially when seasonal humidity shifts the conditioning load. Keep that in mind.
Join our mailing list to receive the latest news and updates from our team.